

Power Of Trading & Investing Combo Course (Odia)
Language:
Odia
Level:
Basic
Duration:
28 Hours
Start From:
October 4, 2026
Class Time:
Every Sunday & Wednesday from 08:00 PM to 10:00 PM.
About Power Of Trading & Investing Combo Course (Odia)
POWER OF TRADING & INVESTING COMBO COURSE (POWER TI) is a complete capital market course designed for learners of all levels of the stock market, where you will learn knowledge of the financial market from the very basics to the advanced level with Expert Mentorship.
What You’ll Learn From This Course
- Basics of Stock Market
- Basics of Technical Analysis
- Basics of Fundamental Analysis
- Integration of Technical & Fundamental Analysis
Who Will Be Benefited From This Course?
- Anybody having interest in Share Markets
- Students
- Investors
- Professional Investors
- Traders
- Professional Traders
- Corporate Executives
- Employees of Brokers and Sub-Brokers
Get Exclusive Invesmentor Facilities

সম্পূর্ণ বাংলায় প্রিমিয়াম Study Material

ট্রেডিং এবং ইনভেস্টিংয়ে Best স্টক Select করার জন্য প্রিমিয়াম Scanner

শেয়ার সমাধান, বাংলা ভাষায় একমাত্র স্টক মার্কেট সাপ্তাহিক
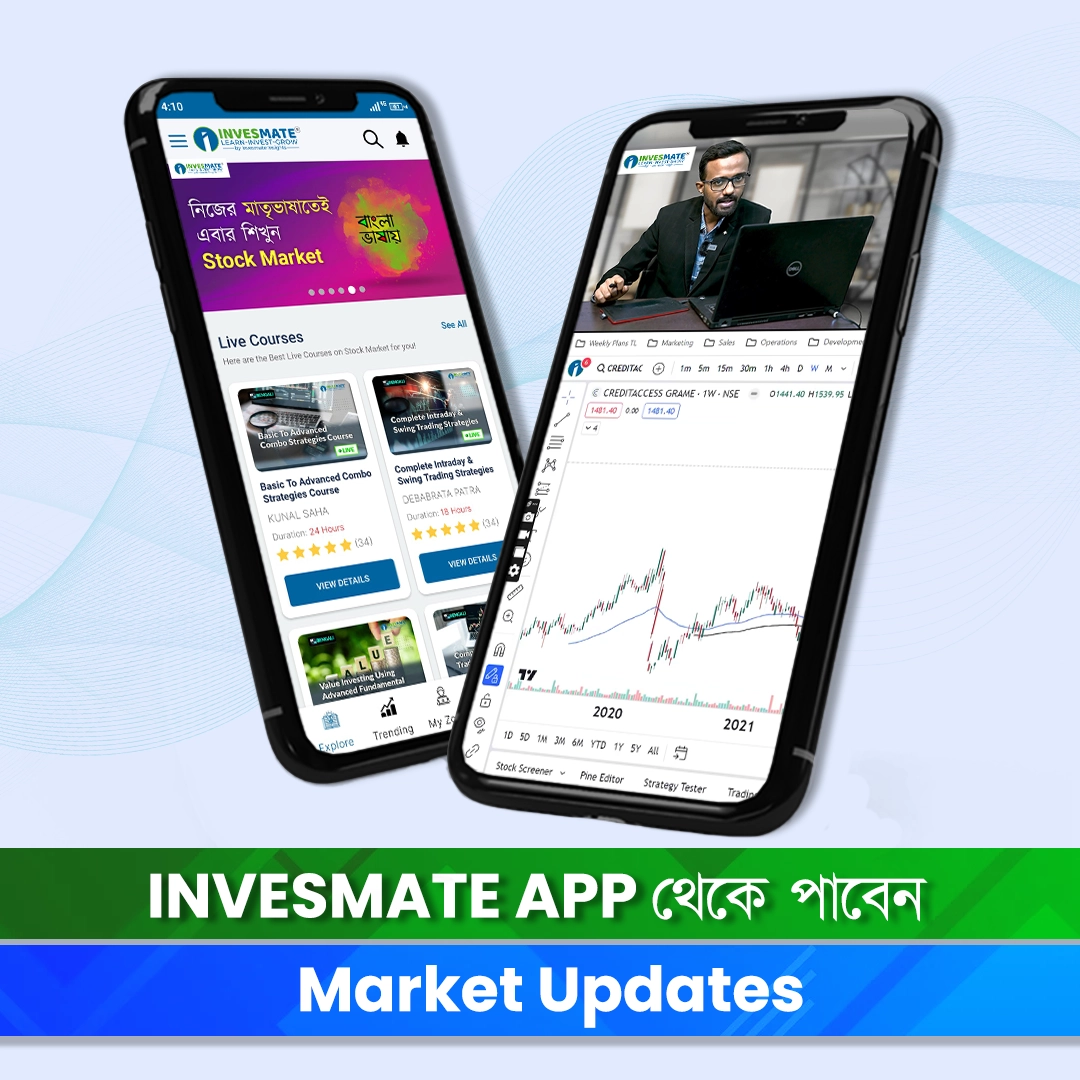
INVESMATE APP থেকে পাবেন Market Updates

প্রত্যেকটা লার্নিং Step-এ পাবেন Hand-holding Guidance

SEBI-এর Investor Awareness Exam Guidance
Power TI Other Facilities
- Course Completion Certificate
- Premium Mutual Funds Course
- Recorded Class Access
- Technical Analysis Support
- Special Academic Support
- Facebook & Telegram Community
Pay Rs. 999/- only & Get Pay Rs. 999/- only & Get
- Access to Our Premium Classes
- Unlimited Messages to Instructor
- Market Research & Updates
Why INVESMATE
- SEBI-Registered Initiative [Reg No.: INH000017985]
- 6 Years of Trust and Achievements
- Qualified NISM-certified Mentors
- Power-packed Program + Mentorship
- Learn in Your Language
- Affordable Course Fees
- 100% Hand-Holding Guidance
- Flexible Timing and Mode of Learning

Completion Certificate
Upon completing the Power Of Trading & Investing Combo Course (Odia) each qualified student will receive an appreciation certificate from INVESMATE.
-
-
-
Market Participant (MM & MF)
-
Institutional Supply and Demand zone mapping
-
Candle Anatomy and Structure for price behavior logic
-
Bulls & Bears & Sideways Directional Market Analysis
-
-
Breakout Momentum Structures
-
Volume Strength Analysis
-
Multi Time frame Analysis
-
Bullish reversal : Upper & Lower rejection candle
-
Loss Protection & Target Projection Framework
-
-
Flow Transition Curve (FTC)
-
Compression–Expansion Model (CEM)
-
Dual Absorption Reclaim (DAR)
-
Retest Validation Logic (RVL)
-
Moving Average Alignment Shift (MAAS)
-
-
Bears Directional Market Analysis
-
Breakdown Momentum Structures with Volume
-
Bearish reversal : Upper & Lower rejection candle
-
Short Selling Logic
-
-
DCM (Distribution Curve Model)
-
CDM (Compression–Drop Model)
-
DRM (Dual Rejection Model)
-
Retest Validation Logic (RVL)
-
Moving Average Alignment Shift for Intraday (MAAS)
-
-
Stock Selection Process
-
Candlestick Behavior Analysis
-
Price Action Behavior Study
-
Risk Management & Position Sizing
-
Intraday CPC Reversal + Breakout Model
-
Intraday Sniper Scanner
-
Volume Flow Mapping
-
Precision Entry Trigger Logic (Camarilla Confluence)
-
-
Bullish Reversal with Multiple Candlestick
-
Structured Swing Entry Blueprint with RSI
-
Divergence-Based Reversal Signals
-
Multi-Indicator Swing Confluence
-
RSI Divergence Usage
-
-
Relative Momentum Positioning Model (Stock vs Index)
-
Advanced Swing Pulse Strategy
-
Advance uses of Fibonacci tools
-
-
Overall Strategy Buildup
-
SMC ( Liquidity Concept)
-
Capital Market Overview
-
-
Multi-System Trade Alignment
-
Capital Allocation Calibration
-
Scanner-Based Opportunity Filtering
-
Execution Psychology & Risk Control
-
Importance of Long-Term Investing
-
Qualitative Analysis (Business & Industry)
-
Introduction to Financial Statements
-
Identifying Fundamentally Strong Companies
-
Quantitative Analysis and Key Ratios
-
Identifying Undervalued & Overvalued Stocks
-
Using Stock Screeners for Selection
-
Investment Decision Framework
-
Trade Psychology in Live Market
-
Fear vs Greed control
-
What NOT to do
-
Q&A in Live Market
Reviews Not Available.